Nathan Wood
Line Types in R
R allows you to specify solid, dashed, or dotted lines in plots. This is useful when paired with color as it helps colorblind individuals or those with non-color printers differentiate between groups in a figure.
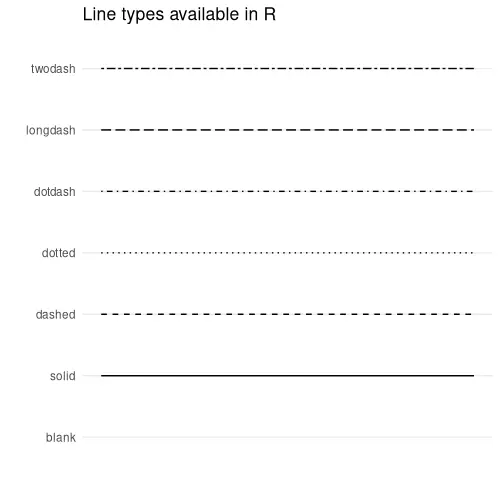
If you want to pull up to line type chart while in your R
environment, you can run the following command, granted you have ggplot2
and ggpubr
installed on your system:
ggpubr::show_line_types() + theme_minimal()Examples
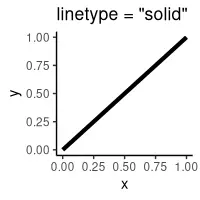
A Singular Line
require(ggplot2)

data <- data.frame(x = seq(0,1,1), y = seq(0,1,1))

# Line Choices: blank, solid, dashed, dotted,
# dotdash, longdash, twodash

ggplot(data = data) +
    geom_line(aes(x=x,y=y),
        col = '#040',
        linewidth = 1.5,     # line width
        linetype = 'solid') +  # EDIT HERE
        ggtitle('linetype = "solid"') +
        theme_classic()
ggplot2.
Using
scale_linetype_manual() to Assign Multiple Line Types
require(ggplot2)

data <-  data.frame(x = seq(0,10,1), y = seq(0,20,2), group = 'y=2x')

addendum <- data.frame(x = seq(0,10,1), y = seq(0,5,0.5),
    group = 'y=0.5x')

data <- rbind(data, addendum)

# Line Choices: blank, solid, dashed, dotted,
# dotdash, longdash, twodash

ggplot(data = data) +
    geom_line(aes(x = x, y = y, linetype = group, color = group),
        linewidth = 1.5) +
    scale_linetype_manual(name = 'Functions',
        values = c('dotted', 'solid')) +        # EDIT HERE
    scale_color_manual(name = "Functions",
        values = c('#000','#00aa00'))
    ggtitle("Comparing Two Line Types") +
    theme_classic()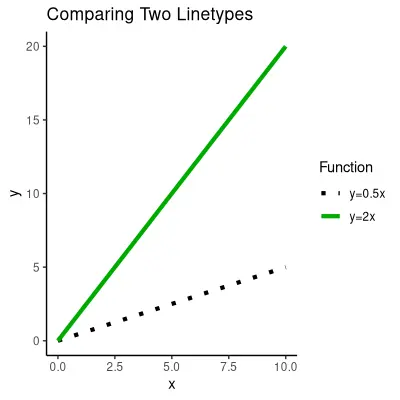
scale_linetype_manual() to assign multiple
line types.